General quality metrics
Data, regardless of location of recording, temporal dimension, level of pre-processing or type of collection, are subject to certain quality metrics. These metrics are used to assess how useful or relevant large data sets or collected data are. In the following sections, each metric will be described in detail. For each metric, examples will be provided to illustrate how it can be calculated and assessed in practice. These examples will include step-by-step explanations and, where applicable, code snippets to demonstrate the computational process.
Data sets can be reliably described using the following metrics.
Of these eleven criteria, all are used in the rarest cases. Which criteria are used depends on the data set and the purpose of the data. Experience shows that the first six criteria are used for data analysis.
Datasets
To test the individual quality metrics, the internet provides free data sets. These data sets can be downloaded from the following link. The programming and analysis examples should largely refer to these data.
In order to test one’s datascience skills on simple and practical datasets, the author of the blog towardsdatascience.com provides over 50 datasets. These can then be integrated into your own IDE or downloaded via the Github page.
Kaggle provides more than 50,000 data sets. This data can be used, for example, as the basis for machine learning algorithms. For this purpose, however, it is necessary to check the data beforehand and to change it if necessary.
Nature.com sources data sets from around the world that relate largely to the Corona pandemic.
Tools and Libraries
Python
ydata_quality is an open-source python library for assessing Data Quality throughout the multiple stages of a data pipeline development.
A holistic view of the data can only be captured through a look at data from multiple dimensions and ydata_quality evaluates it in a modular way wrapped into a single Data Quality engine. This repository contains the core python source scripts and walkthrough tutorials.
Pandas is a fast, powerful, flexible and easy to use open source data analysis and manipulation tool, built on top of the Python programming language.
NumPy offers comprehensive mathematical functions, random number generators, linear algebra routines, Fourier transforms, and more.
Literature
Completeness
Description
Measured, stored or recorded data must have all necessary attributes. So-called NaN values result from faulty operations and reduce completeness. To improve this quality dimension, you can assess your data whether all your information is available or whether there are any missing elements.
Tools and Libraries
Python
In order to measure the completeness of a data set, it makes most sense to identify data gaps and, if necessary, to quantify them. In the following, a simple example and functions will show how data gaps can be identified.
Install pandas and numpy via command:
pip install pandas

pip install numpy
# import pandas
import pandas as pd

# import numpy
import numpy as np

# dictionary of lists
dict = {
    "column a": [0, 90, np.nan, 95],
    "column b": [30, 45, 56, 0],
    "column c": [np.nan, 40, 80, 98],
    "column d": [np.nan, 12, 35, None],
}

# creating a dataframe from list
df = pd.DataFrame(dict)
Identifying missing data
Simple dataframe with four columns where None- and np.nan-Values occur.
That values occur in the formats mentioned is not always the case. How to identify and quantify completely empty cells can be read here <link>.
# import pandas
import pandas as pd

# import numpy
import numpy as np

# dictionary of lists
dict = {
    "column a": [0, 90, np.nan, 95],
    "column b": [30, 45, 56, 0],
    "column c": [np.nan, 40, 80, 98],
    "column d": [np.nan, 12, 35, None],
}

# creating a dataframe from list
df = pd.DataFrame(dict)
Following functions can be used to create two arrays with row- and column-coordinates of the missing data for later computation.
The dataframe looks the following:
    column a  column b  column c  column d
0       0.0        30       NaN       NaN
1      90.0        45      40.0      12.0
2       NaN        56      80.0      35.0
3      95.0         0      98.0       NaN
# import numpy
import numpy as np

def missing_value_coordinates(dataframe):
    """Finds missing value in dataframes

    Args:
        dataframe (pd.dataframe): Input dataframe created from a csv-file

    Returns:
        array: arrays with row and column indices
    """

    return np.where(np.asanyarray(np.isnan(dataframe)))
Output of the function missing_value_coordinates()
In [1]: missing_value_coordinates(dataframe)

Out[2]: (array([0, 0, 2, 3, 3], dtype=int64), array([2, 3, 0, 1, 3], dtype=int64))
To count the number of missing values columnwise you can the following function which is a combination of two functions.
def count_missing_value(dataframe):
    """Counts missing values in a dataframe

    Args:
        dataframe (pd.dataframe): Input dataframe created from a csv-file

    Returns:
        int: Summed up counts of missing values
    """

    return dataframe.isnull().sum()
The output when the example dataframe is used. Now you can see in which column and how values are missing.
In [1]: count_missing_value(dataframe)

Out[2]: column a    1
        column b    1
        column c    1
        column d    2
Sometimes one works with data sets in which values are missing from the outset and these are not easily visible as in the last example. This can be investigated using an open source marketing data set.
In [1]:  df = pd.read_csv(
         r"C:/Users/Goerner/Desktop/Datasets/marketing_campaign.csv", delimiter="\t"
         )

         df.iloc[10,:7]

Out[2]:  ID                      1994
         Year_Birth              1983
         Education         Graduation
         Marital_Status       Married
         Income                   NaN
         Kidhome                    1
         Teenhome                   0
In this example the output when counted nan-values for the first seven columns will be:
In [1]: count_missing_value(dataframe.iloc[:,:7])

Out[2]:  ID                 0
         Year_Birth         0
         Education          0
         Marital_Status     0
         Income            24
         Kidhome            0
         Teenhome           0
Removing missing data
Missing data can be problematic for machine-learning algorithms, for example, because many models cannot handle missing values. For this situation, it makes sense to remove rows with missing data.
To do this, several steps must be carried out. The first step is to declare what constitutes a missing datum and the second step is to convert these values into nan values and remove the corresponding row.
# import numpy
import numpy as np

def replace_missing_value(dataframe, values: list):
    """_summary_

    Args:
        dataframe (pd.dataframe): Input dataframe created from a csv-file
        values (list): List of values to replace with np.nan

    Returns:
        pd.dataframe: Dataframe with replaced values
    """
    for type in values:

        new_dataframe = dataframe.replace(type, np.nan)

    return new_dataframe
For example None and 0 will be replaced with NaN-Values.
In [1]: replace_missing_value(dataframe, value_types = [str(None), 0])

Out[2]:      column a  column b  column c  column d
       0       NaN      30.0       NaN       NaN
       1      90.0      45.0      40.0      12.0
       2       NaN      56.0      80.0      35.0
       3      95.0       NaN      98.0       NaN
Rows with None and 0 will be dropped. A clean dataframe is the result.
In [1]: dataframe.dropna(inplace=True)

Out[2]: column a  column b  column c  column d
  1      90.0        45      40.0      12.0
Measure completeness
There are several ways to determine the completeness of a data set. The completeness can refer to individual entries, columns or rows. Some trivial functions are now provided for the respective situations.
Calculation of complete dataseries:
def complete_data_series(dataframe):
    """Calcualtes the degree of complete rowwise entries in a give dataframe

    Args:
        dataframe (pd.dataframe): Input dataframe created from a csv-file

    Returns:
        float: Degree of complete rowwise entries in a give dataframe

    """

    row_count_missing_data = dataframe.isnull().any(axis=1).sum()

    return 1 - (row_count_missing_data / len(dataframe))
Proportion of missing data:
def degree_of_completeness(dataframe):
    """Calculates the degree of complete entries in a dataframe

    Args:
        dataframe (pd.dataframe): Input dataframe created from a csv-file

    Returns:
        float: Dgree of complete entries in a give dataframe
    """

    missing_data_count = dataframe.isnull().sum().sum()

    return 1 - (missing_data_count / dataframe.size)
Unambiguous
Description
Each data record must be unambiguously interpretable. If entries differ only by one characteristic or only by the ID, a duplicate analysis is to be preferred because there is reasonable doubt that it is not the same entry.
Tools and Libraries
Python
In Python’s Pandas library, Dataframe class provides a member function to find duplicate rows based on all columns or some specific columns. It returns a Boolean Series with True value for each duplicated row.
Install pandas via command:
pip install pandas
Find ambiguous entries
To check if rows occur multiple time you can use this code snippet which will check if an row is identical to a provious row.
# import pandas
import pandas as pd

# load dataset
df = pd.read_csv(r"C:/Users/Datasets/marketing_campaign.csv", delimiter=";")


def find_ambiguous_sets(dataframe, list_of_columns=None):
    """

    Args:
        dataframe (pd.dataframe): Input dataframe created from a csv-file
        list_of_columns (list, optional): List of columns to check for duplications. Defaults to None to check every column

    Returns:
        dataframe: Dataframe with ambiguous rows to double check.
    """

    return dataframe[dataframe.duplicated(list_of_columns, keep="first")]
If used on the preloaded dataframe the function shows that three rows are duplicates. With the list_of_columns-Parameter you can subset the columns to find duplicated column values. The more values there are that more ambiguous a dateset can be.
In [1]:  find_ambiguous_sets(dataframe, list_of_columns=None)

Out[2]:  ID  Year_Birth   Education Marital_Status   Income  ...  AcceptedCmp2  Complain Z_CostContact  Z_Revenue  Response
         89   3033        1963      Master       Together  38620.0  ...             0         0             3         11         0
         131  4646        1951    2n Cycle        Married  78497.0  ...             0         0             3         11         0
         197   326        1973  Graduation        Married  51148.0  ...             0         0             3         11         0
Measure unambiguous
Since the pure number of duplicated columns has little significance, the following function can be used to determine the degree of uniqueness. Since only three entries are duplicated, the degree is almost one.
def degree_of_unambiguous(dataframe, list_of_columns=None):
    """Sums up numbwe of ambiguous rows

    Args:
        dataframe (pd.dataframe): Input dataframe created from a csv-file

    Returns:
        float: Degree of which a dataframe is unambiguous
    """

    sum_of_duplicates = dataframe.duplicated(subset=list_of_columns, keep="first").sum()

    return ((dataframe.size - sum_of_duplicates) / dataframe.size) * 100
In [1]:  degree_of_unambiguous(df)

Out[2]:  99.86625055728935
Correctness
Description
The data should match the conditions in reality as closely as possible. Measurement data should have as low an error value as possible.
Detecting anomalies in a dataset can be critical for some businesses if hasty conclusions are drawn or hasty decisions are made. To rid data sets of such anomalies, these outliers must be identified. Outliers are values that are irrationally far from their expected value. The danger of outliers is that they influence average values and the standard deviation.
Outliers can be values of just one variable or combination of at least two variables that can be considered as outliers.
Tools and Libraries
Python
Python provides several methods to easily identifying outliers and statistical anomalies.
Install pandas via command:
pip install pandas
Find outliers in a given dataframe
The following data set contains sensor data from measuring stations at various beaches. For example, water temperature, wave size and wave period were recorded. To load dataset and plot the distribution of the water temperature use the following snippet.
# import pandas
import pandas as pd
#import matplotlib
import matplotlib.pyplot as plt
#import seaborn
import seaborn as sns

# load dataset
df = pd.read_csv(r"C:/Users/Datasets/beachwater.csv", delimiter=";")

plt.figure(figsize=(16, 5))
plt.subplot(1, 1, 1)
sns.distplot(df["Water Temperature"])
plt.show()
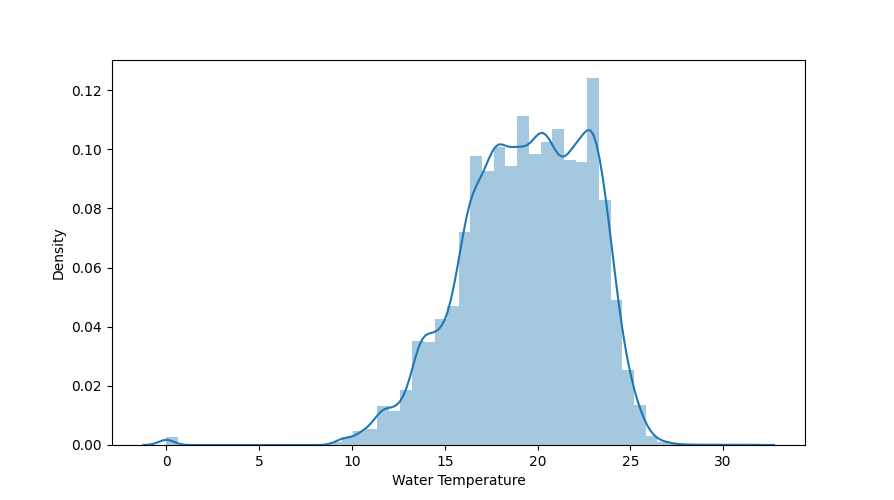
For Normal distributions: Use empirical relations of Normal distribution. The data points which fall below mean-3*(sigma) or above mean+3*(sigma) are outliers. Where mean and sigma are the average value and standard deviation of a particular column.
In this case, data that is far from 99% quantile is considered as outlier. So the first step is to calculate the maximum and minimum temperature.
In [1]:  "Highest allowed", df["Water Temperature"].mean() + 3 * df["Water Temperature"].std()
         "Lowest allowed", df["Water Temperature"].mean() - 3 * df["Water Temperature"].std()

Out[2]:  Highest allowed 29.434111975462184
         Lowest allowed 9.292662947927571
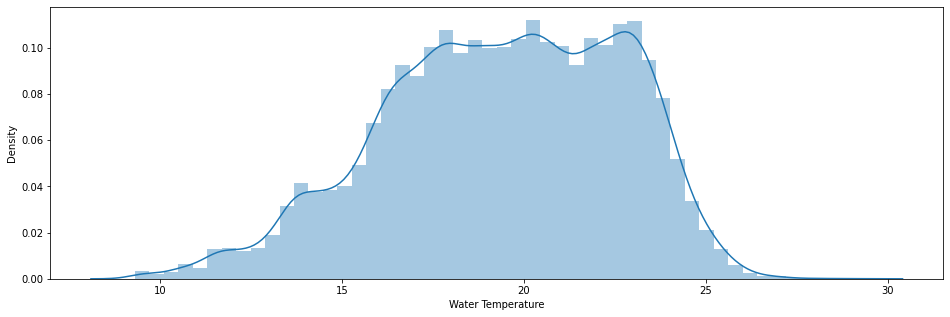
Using the limitation created using mean and a multiplication of the standard deviation you can clean and plot the cleaned dataframe.
# import pandas
import pandas as pd
#import matplotlib
import matplotlib.pyplot as plt
#import seaborn
import seaborn as sns

# load dataset
df = pd.read_csv(r"C:/Users/Datasets/beachwater.csv", delimiter=";")


df[(df["Water Temperature"] > 29.43) | (df["Water Temperature"] < 9.29)]

new_df = df[(df["Water Temperature"] < 29.43) & (df["Water Temperature"] > 9.29)]


plt.figure(figsize=(16, 5))
plt.subplot(1, 1, 1)
sns.distplot(new_df["Water Temperature"])
plt.show()
Timeliness and Punctuality
Description
All data sets must correspond to the desired current state of the depicted reality. If, in order to answer the research question, data is needed that is current in time.
If not up to date or out of date, this can have very strong negative effects on the results. Data that may have been up to date last month could be useless now.
For example, machine learning models trained on old datasets can produce erroneous results or lead researchers to incorrect conclusions.
To measure timeliness, you may take a small sample of “golden records” for which you have the current value.
Tools and Libraries
Unfortunately, there are no technical tools to determine whether a dataset is up-to-date or not. However, by declaring minimum and maximum times in which a dataset has been updated, a certain quality can be maintained.
The timeliness of data can be on different levels. The creation date of a file alone can be an indication of whether data is old or young. This information can usually be obtained from the metadata.
Python
Whether a file is up-to-date can be defined in several ways. On the one hand, the date of creation of the file can be a more or less good indicator. To be able to check the actuality better, data from the file should be compared with data from the real world. If these match, one can assume that the file is up to date.
To check the metadata we need to import the packages os (Operationsystem) and time.
Install os and time via command:
pip install os

pip install time
# import os
# import time
import os
import time


def creation_time(filepath: str):
    """Recieve creation time of a file

    Args:
        filepath (str): path to csv-file

    Returns:
        time: Time the file was created
    """
    return time.ctime(os.path.getmtime(filepath))
A better way to measure the timeliness of data is to look at parts of the dataset and compare real-time data.
Accuracy
Description
Data accuracy is a key characteristic of data quality. This metric refers to the fact that values for a specific object are mapped in the correct format and size. This metric is used to emphasise the correctness and consistency of data and to prevent ambiguity.
If one questions whether the recorded data reflects the real world. Here, accuracy can refer to decimal places of decimal numbers or even trivially to the incorrect spelling of names and addresses.
Accuracy can be determined using ground truth, an alternative data recording. Data accuracy can be described by the standard error.
Tools and Libraries
Python
Install numpy and scipy via command:
pip install numpy

pip install scipy
Using numpy to calculate standard error
# import numpy
import numpy as np

# define dataset
data = np.array(
    [3, 4, 4, 5, 7, 8, 12, 14, 14, 15, 17, 19, 22, 24, 24, 24, 25, 28, 28, 29]
)

# calculate standard error of the mean
np.std(data, ddof=1) / np.sqrt(np.size(data))
Using scipy.stats to calculate standard error
# import scipy
from scipy.stats import sem

# define dataset
data = [3, 4, 4, 5, 7, 8, 12, 14, 14, 15, 17, 19, 22, 24, 24, 24, 25, 28, 28, 29]

# calculate standard error of the mean
sem(data)
Consistency
Description
A data set must not have any contradictions within itself or with other data sets. Data are inconsistent if different valid states are not compatible with each other.
Consistency is for measuring if two data values derived by different sets aren’t conflicting with each other. The percent of values that match across various records is a common data quality metric for consistency.
Consistency refers primarily to the use of data by different users. Examples of consistent data usually refer to data formats and data types that should be identical throughout in order to maintain a required level of data quality.
Inconsistencies in data can be due to changes over time and/or across variables for example, in
Vintages or time periods
Units
Levels of accuracy
Levels of completeness
Types of inclusion or exclusions.
Tools and Libraries
Python
Install pandas and numpy via command:
pip install pandas

pip install numpy
Standard deviation is absolute measure of dispersion.
Note
Quote: However one could find which series is more consistent than other by coefficient of variation, that is relative measure of dispersion based on standard deviation multiplied by 100.
We can calculate consistency using standard deviation and mean of the given date:
Note
Code Snipped comming soon.
The data having lower coefficient of Variation is more consistent and vice - versa.
Checking for inconsistent datatypes
For the processing and use of data such as time series or numerical values, it is indispensable that data types must not differ. To check a data set for inconsistency, the following function can be used. It provides information about which columns are inconsistent.
# importing pandas
import pandas as pd

# importing numpy
import numpy as np

# dictionary of lists
dict = {
    "column a": [0, 90, np.nan, "wort"],
    "column b": [30, 45, 56, 0],
    "column c": [np.nan, 40, 80, 98],
    "column d": [np.nan, 12, 35, None],
}

# creating a dataframe from list
df = pd.DataFrame(dict)

# define function to check for different datatypes
def check_for_types(dataframe):
    """Check if columns of a dataframe consists of different datatypes

    Args:
        dataframe (pd.dataframe): Input dataframe created from a csv-file
    """
    for dtype, column in zip(dataframe.dtypes, dataframe.columns):
        if dtype == object:
            print(f'{column} contains multiple different datatypes!')
In [1]: check_for_types(df)

Out[2]: column a contains multiple different datatypes!
Freedom from redundancy
Description
It is essential to identify duplicate data, which can be extremely difficult. With numerical measurement data, it is almost impossible to identify duplicate numbers. Therefore, it is better to compare complete data series and decide individually if it is a duplicate recording.
Tools and Libraries
Install pandas
pip install pandas
Python
The pandas.DataFrame.duplicated() method is used to find duplicate rows in a DataFrame. It returns a boolean series which identifies whether a row is duplicate or unique.
#import pandas
import pandas as pd

data_df = {
    "Name": ["Arpit", "Riya", "Priyanka", "Aman", "Arpit", "Rohan", "Riya", "Sakshi"],
    "Employment Type": [
        "Full-time Employee",
        "Part-time Employee",
        "Intern",
        "Intern",
        "Full-time Employee",
        "Part-time Employee",
        "Part-time Employee",
        "Full-time Employee",
    ],
    "Department": [
        "Administration",
        "Marketing",
        "Technical",
        "Marketing",
        "Administration",
        "Technical",
        "Marketing",
        "Administration",
    ],
}

df = pd.DataFrame(data_df)

# Use the DataFrame.duplicated() method to return a series of boolean values
bool_series = df.duplicated()
Relevance
Description
Relevance in data quality refers to the usefulness of collected data and whether this data is needed for further processing. However, the concept of “relevance” can vary depending on the specific context and requirements of your task.
In the following example, a data set is examined for a criterion, i.e. a word or a numerical value. If the data set contains the criterion, it is classified as relevant.
Tools and Libraries
Install pandas
pip install pandas
Python
Load the needed dataset as showed in the following code snippet:
# import pandas
import pandas as pd

# load dataset
df = pd.read_csv(r"C:/Users/Datasets/beachwater.csv", delimiter=";")

print(df)
If we look at the data set, we see that the first column contains the name of the individual beaches. This is a good selection criterion to check the relevance.
In [1]: print(df)

Out[2]: Beach Name   Measurement Timestamp  Water Temperature  Turbidity  ... Wave Period Battery Life  Measurement Timestamp Label               Measurement ID
     0         Montrose Beach  08/30/2013 08:00:00 AM               20.3       1.18  ...         3.0          9.4            8/30/2013 8:00 AM    MontroseBeach201308300800
     1      Ohio Street Beach  05/26/2016 01:00:00 PM               14.4       1.23  ...         4.0         12.4           05/26/2016 1:00 PM  OhioStreetBeach201605261300
     2          Calumet Beach        09.03.2013 16:00               23.2       3.63  ...         6.0          9.4             09.03.2013 16:00     CalumetBeach201309031600
     3          Calumet Beach  05/28/2014 12:00:00 PM               16.2       1.26  ...         4.0         11.7           5/28/2014 12:00 PM     CalumetBeach201405281200
     4         Montrose Beach  05/28/2014 12:00:00 PM               14.4       3.36  ...         4.0         11.9           5/28/2014 12:00 PM    MontroseBeach201405281200
The following function returns whether a search word is present in the dataset. With this simple function, the exploratory part of the data analysis can be discarded if it is clear from the beginning that relevance is not guaranteed.
def check_dataset_relevance(df, keyword):
    """This function gives feedback if a given keywords exists in a dataframe.

    Args:
        df (dataframe): dataframe to search in
        keyword (string): Keyword as criteria to look for in the given dataframe
    """

    # Check if the keyword is present in any column of the DataFrame
    keyword_found = any(df.apply(lambda row: keyword in str(row), axis=1))

    if keyword_found:
        print(f"The dataset is relevant. It contains the keyword '{keyword}'.")
    else:
        print(f"The dataset is not relevant. It does not contain the keyword '{keyword}'.")
With this function we can, for example, search the beach dataset for specific beaches. In our case, we can find out if there is sensor data for Ohio Street Beach.
In [1]: df["height_new"] = df.apply(lambda row: get_inches(row["Height"]), axis=1)

Out[2]: The dataset is relevant. It contains the keyword 'Ohio Street Beach'.
Relevance can be understood in many ways. Therefore, the previous example is only a small excerpt of what is possible.
Uniformity
Description
The information of a data set must be structured in a uniform way. Data of the same type should also have the same dimensions.
Uniformity is therefore specific to metrics and units of measurement, and is particularly important when data comes from different sources.
In the following examples, data will be compared for uniformity and if necessary recalculated to fit uniformity.
Tools and Libraries
Install pandas
pip install pandas
Python
Load the needed dataset as showed in the following code snippet:
# import pandas
import pandas as pd

# load dataset
df = pd.read_csv(r"C:\Users\Datasets\basketballteam.csv", delimiter=",")
In [1]: print(df.head())

Out[2]:       Name  Height Handedness
       0      Jon    6'5"      Right
       1      Rob  6'7.5"       Left
       2   Sharon    6'3"      Right
       3     Alex    6'2"      Right
       4  Rebecca      7'      Right
As you can see, the height column contains impirical dimensions. For further processing or comparison with metric data, it is necessary to convert from feet and inches to metres and centimetres.
The following function can be used to convert the data from inches to metres.
# import re
import re

import pandas as pd

r = re.compile(r"(?:^(?:(\d+)')?(?:[-| ]*)(?:(\d*(?: ?\d+\/\d+)?|(?:\d*\.\d+)?)?\")?$)")

def get_inches(height):
    """Calculates the number of inches in a given impirical height.

    Args:
        height (string): hieght consisting of feet and inches as string

    Returns:
        float: Number of inches
    """
    m = r.match(height)

    print(int(m.group(1)))

    if not m.groups()[1]:

        return float('NaN') if m is None else int(m.group(1))*30.48

    else:

        return float('NaN') if m is None else float(m.group(1))*30.48 + float(m.group(2))*2.54


# load dataset
df = pd.read_csv(r"C:\Users\Datasets\basketballteam.csv", delimiter=",")

df["height_new"] = df.apply(lambda row: get_inches(row["Height"]), axis=1)

print(df)
Now you can apply this function to the whole column and recalculate to meters
In [1]: df["height_new"] = df.apply(lambda row: get_inches(row["Height"]), axis=1)

Out[2]:       Name  Height Handedness  height_new
       0      Jon    6'5"      Right      195.58
       1      Rob  6'7.5"       Left      201.93
       2   Sharon    6'3"      Right      190.50
       3     Alex    6'2"      Right      187.96
       4  Rebecca      7'      Right      213.36
       5   Ariane    5'8"       Left      172.72
       6    Bryon      7'      Right      213.36
       7    Brett      6'      Right      182.88
       8     Matt    5'5"      Right      165.10
After applying the function, all body sizes were converted from imperial system to metric system.
Reliability
Description
Data reliability can refer to the origin of the data on the one hand. So the source of the data is reliable and trustworthy. And on the other hand, reliability can also refer to intrinsic quality characteristics such as completeness, accuracy and freedom from redundancy.
Since reliability is a summary of the previous quality metrics, this value can only be determined indirectly and should be clearly defined by the researcher beforehand.
For example, reliability can be a combination of accuracy, completeness and consistensy. A value can then be a combination of these metrics with different weights. Depending on the needs of the researcher.